Retained method source
Measures of Location
Describe the displayed records
Approval intervals and resolved durations have separate medians. Each sorts the displayed records in its own endpoint category; with an even number, the median is the arithmetic mean of the two middle durations. Pending ages are excluded from both. Settled share divides displayed settled matters by displayed resolved matters and does not include approval records. The phase band uses arithmetic means from one shared group: displayed records with the selected endpoint category, complaint date and exact named milestone. No missing date is filled in, and unlike milestones or endpoint categories are not pooled.
The description above explains this tool’s implementation. The publisher’s complete retained reading follows.
Source identity and integrity
Complete Measures of Location article, including definitions, distribution examples, robustness discussion, alternative measures, case-study/software conclusion, and its original four-panel histogram figure.
Retained original · 16,636 bytes1c7c9ea88bc35068ecee52e340e64924e905f921534963cfd480c919d211e1dd
Reading copy · 9,648 bytese2e5a82d6ec01ff293e7a93f113e2c78a8247f70c33ca5a7d9dc582bd695b93e
Full retained text
Text mechanically extracted from the retained publisher source. Use the original or publisher page to inspect mathematical typesetting and layout.
1.3.5.1. Measures of Location

1.
Exploratory Data Analysis

1.3.
EDA Techniques

1.3.5.
Quantitative Techniques

1.3.5.1.

Measures of Location

Location

A fundamental task in many statistical analyses is to estimate
a location parameter for the distribution; i.e., to find a
typical or central value that best describes the data.

Definition of Location

The first step is to define what we mean by a typical value.  For
univariate data, there are three common definitions:


 mean - the mean is the sum of the data points divided by
        the number of data points.  That is,


           \[ \bar{Y} = \sum_{i=1}^{N}Y_{i}/N \]


        The mean is that value that is most commonly referred to
        as the average.  We will use the term average as a synonym
        for the mean and the term typical value to refer generically
        to measures of location.


 median - the median is the value of the point which has
        half the data smaller than that point and half the data
        larger than that point.  That is, if X1,
        X2, ... ,XN is a random sample
        sorted from smallest value to largest value, then the
        median is defined as:


           \[ \tilde{Y} = Y_{(N+1)/2} \;\;\;\;\;\; \mbox{if $N$ is odd} \]


\[ \tilde{Y} = (Y_{N/2} + Y_{(N/2)+1})/2 \;\;\;\;\;\; \mbox{if $N$ is even} \]


 mode - the mode is the value of the random sample that
         occurs with the greatest frequency.  It is not
         necessarily unique.  The mode is typically used in
         a qualitative fashion.  For example, there may be a single
         dominant hump in the data perhaps two or more smaller
         humps in the data.  This is usually evident from a histogram
         of the data.

         When taking samples from continuous populations, we need
         to be somewhat careful in how we define the mode.  That
         is, any specific value may not occur more than once if
         the data are continuous.  What may be a more meaningful, if
         less exact measure, is the midpoint of the class interval of
         the histogram with the highest peak.


Why Different Measures

A natural question is why we have more than one measure of the
typical value.  The following example helps to explain why these
alternative definitions are useful and necessary.

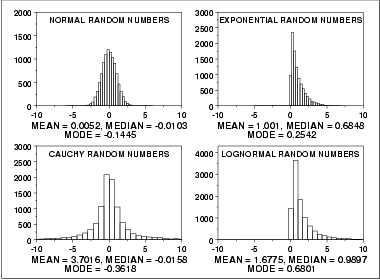
This plot shows histograms for 10,000 random numbers generated from
a normal, an exponential, a Cauchy, and a lognormal distribution.

Normal Distribution

The first histogram is a sample from a normal
distribution.  The mean is 0.005, the median is -0.010, and the
mode is -0.144 (the mode is computed as the midpoint of the
histogram interval with the highest peak).

The normal distribution is a symmetric distribution with
well-behaved tails and a single peak at the center of the distribution.
By symmetric, we mean that the distribution can be folded about
an axis so that the 2 sides coincide.  That is, it behaves the
same to the left and right of some center point.  For a normal
distribution, the mean, median, and mode are actually equivalent.
The histogram above generates similar estimates for the mean, median,
and mode.  Therefore, if a histogram or normal probability plot
indicates that your data are approximated well by a normal
distribution, then it is reasonable to use the mean as the location
estimator.

Exponential Distribution

The second histogram is a sample from an
exponential distribution.
The mean is 1.001, the median is 0.684, and the mode is 0.254
(the mode is computed as the midpoint of the histogram interval
with the highest peak).

The exponential distribution is a skewed, i. e., not symmetric,
distribution.  For skewed distributions, the
mean and median are not the same.  The mean will be pulled in the
direction of the skewness.  That is, if the right tail is
heavier than the left tail, the mean will be greater than the
median.  Likewise, if the left tail is heavier than the right
tail, the mean will be less than the median.

For skewed distributions, it is not at all obvious whether the
mean, the median, or the mode is the more meaningful measure of the
typical value.  In this case, all three measures are useful.

Cauchy Distribution

The third histogram is a sample from a
Cauchy distribution.  The
mean is 3.70, the median is -0.016, and the mode is -0.362
(the mode is computed as the midpoint of the histogram interval
with the highest peak).

For better visual comparison with the other data sets, we restricted
the histogram of the Cauchy distribution to values between -10 and
10.  The full Cauchy data set in fact has a minimum of
approximately -29,000 and a maximum of approximately 89,000.

The Cauchy distribution is a symmetric distribution with heavy
tails and a single peak at the center of the distribution.
The Cauchy distribution has the interesting property that
collecting more data does not provide a more accurate estimate
of the mean.  That is, the sampling distribution of the mean
is equivalent to the sampling distribution of the original data.
This means that for the Cauchy distribution the mean is useless
as a measure of the typical value.  For this histogram, the mean of 3.7
is well above the vast majority of the data.  This is caused by
a few very extreme values in the tail.  However, the median does
provide a useful measure for the typical value.

Although the Cauchy distribution is an extreme case, it does
illustrate the importance of heavy tails in measuring the
mean.  Extreme values in the tails distort the mean.  However,
these extreme values do not distort the median since the median
is based on ranks.  In general, for data with extreme values in
the tails, the median provides a better estimate of location
than does the mean.

Lognormal Distribution

The fourth histogram is a sample from a
lognormal distribution.  The
mean is 1.677, the median is 0.989, and the mode is 0.680
(the mode is computed as the midpoint of the histogram interval
with the highest peak).

The lognormal is also a skewed distribution.  Therefore the
mean and median do not provide similar estimates for the location.
As with the exponential distribution, there is no obvious answer
to the question of which is the more meaningful measure of location.

Robustness

There are various alternatives to the mean and median for
measuring location.  These alternatives were developed to address
non-normal data since the mean is an optimal estimator if in
fact your data are normal.

Tukey and Mosteller
defined two types of robustness where robustness is a
lack of susceptibility to the effects of nonnormality.


Robustness of validity means that the confidence intervals
       for the population location have a 95% chance of covering the
       population location regardless of what the underlying
       distribution is.


Robustness of efficiency refers to high effectiveness
       in the face of non-normal tails.  That is, confidence
       intervals for the population location tend to be almost as
       narrow as the best that could be done if we knew the
       true shape of the distributuion.

The mean is an example of an estimator that is the best we can do
if the underlying distribution is normal.  However, it lacks
robustness of validity.  That is, confidence intervals based
on the mean tend not to be precise if the underlying
distribution is in fact not normal.

The median is an example of a an estimator that tends to have
robustness of validity but not robustness of efficiency.

The alternative measures of location try to balance these
two concepts of robustness.  That is, the confidence intervals for the
case when the data are normal should be almost as narrow as the
confidence intervals based on the mean.  However, they should
maintain their validity even if the underlying data are not
normal.  In particular, these alternatives address the problem of
heavy-tailed distributions.

Alternative Measures of Location

A few of the more common alternative location measures are:


Mid-Mean - computes a mean using the data between the
       25th and 75th percentiles.


Trimmed Mean - similar to the mid-mean except different
       percentile values are used.  A common choice is to trim
       5% of the points in both the lower and upper tails, i.e.,
       calculate the mean for data between the 5th and 95th
       percentiles.


Winsorized Mean - similar to the trimmed mean.  However,
       instead of trimming the points, they are set to the lowest
       (or highest) value.  For example, all data below
       the 5th percentile are set equal to the value of the
       5th percentile and all data greater than the 95th
       percentile are set equal to the 95th percentile.


Mid-range = (smallest + largest)/2.


The first three alternative location estimators defined above have the
advantage of the median in the sense that they are not unduly affected
by extremes in the tails.  However, they generate estimates that are
closer to the mean for data that are normal (or nearly so).

The mid-range, since it is based on the two most extreme points, is
not robust.  Its use is typically restricted to situations in which
the behavior at the extreme points is relevant.

Case Study

The uniform random numbers case
study compares the performance of several different location
estimators for a particular non-normal distribution.

Software

Most general purpose statistical software programs can compute at least
some of the measures of location discussed above.